

Digital marketing isn’t just about fancy branding or buzzwords, it’s about measurements. It’s difficult to measure how effective a website is, or how attractive an offering seems without first establishing the metrics.
The following are some of the most important metrics to track in evaluating your business’s digital presence on Google Analytics, the gold standard for web analytics.
1. Traffic
Traffic is the most popular and straightforward metric: it’s the measure of how many people visit your website. You can segment further by new vs. returning visitors, by channel, by landing page, and more.
New vs. Returning
In Google Analytics, segmenting your traffic between new and returning visitors is a great way to understand your website’s audience. If there’s a lot of returning visitors, you may have great, relevant content that appeals to your current users. In these cases, you may want to explore the user’s search intent or the purpose for why they typed in the search query. If there are more new users, consider creating more engaging content on your website.
Channel Specific
There are four types of traffic channels:
- Direct traffic focuses on users who directly type in your website’s URL into the search bar, or click on a bookmarked link to your site.
- Referral traffic analyzes users who came to your website from another website, such as a link inserted in a blog post.
- Organic traffic is usually the highest, as it measures the number of visitors who found your website through a search engine such as Google, Bing or Yahoo!.
- Social measures the number of visitors from a social media platform, including (but not limited to) Facebook, Twitter, Google Plus, and LinkedIn.
2. Sessions
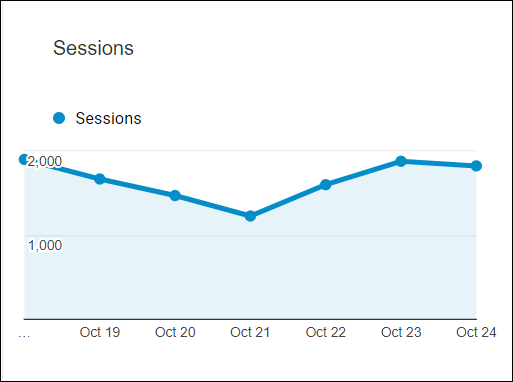
Sessions are unique from visits, and take into account specific actions a user does on the website rather than the number of pages they see. While a visit is counted as each time a user lands on your website, a session groups that user’s interactions and visits together in a certain time frame unless they take no action after 30 minutes (which you can adjust).
For example, if a person visits your website to read your About page, then visits another website, then comes back and looks at another page within 30 minutes, that would count as 2 visits, but only 1 session (since it was before 30 minutes). If it were longer than 30 minutes in between, it would count as 2 visits and 2 sessions.
3. Conversion Rate
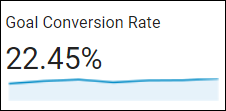
Conversions are where your attention should be most focused. While traffic indicates how many people come to the website, the conversion rate measures how many times they take an action on your website that moves them further along your sales funnel. They’re the surest indication of a visitor who is, at the very least, interested in your services or products.
Conversions can take shape as a click on a specific link, downloading a file or free resource, filling out a form, creating an account, or purchasing a product. What you define as a conversion is specific to your business, but think of it as a customer’s action on your website that relates to or furthers a certain business goal.
4. Click-through Rate (CTR)
The click-through rate metric refers to your display ad efforts: the ratio of people who see your ad, and the number of people that actually click on it (or more simply, ad clicks divided by ad impressions = CTR).
This metric measures how effective your ads are in capturing people’s interest and driving them to your website. Higher click-through rates imply a more successful ad. Since most users have been trained to ignore display ads, a conversion rate of 2 or 3 people per thousand is the usual average.
5. Bounce Rate
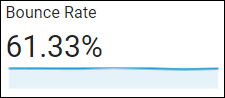
Put simply, a bounce is a single-page session on your website. If a person finds a blog post you published on Facebook, clicks and reads it, then exits out, that counts as one bounce.
Bounce rate is the ratio of bounces to your total sessions or single-page sessions divided by all sessions. It measures how many times your visitors are only reading one page. A high bounce rate isn’t necessarily a bad thing, it just depends on what your website offers. If you have numerous products or articles on your website, you’ll want to interlink them to ensure a lower bounce rate.
6. Search Query Reports
Google Analytics gives you access to the keywords that users typed in that lead to your website. While it doesn’t include all the data, it’s still a useful basis for understanding how users find you. Go into Acquisition > Search Console > Queries. This will bring up a list of real keywords people used to find your website, sorted by clicks, impressions, CTR rate and average ranking position. Use this information to find out which keywords:
- Display your website but don’t generate enough clicks (opportunity for new content)
- Generate the most clicks for your website (opportunity for more focused content)
- Rank your webpages the highest on Google (opportunity to focus on pages that could rank higher)
7. Subscriber List
Enticing users to sign up for an email list is a great way to remarket to your existing audience. Consider including a “sign up for our newsletter” box beside your blogs, and you can mail your readers whenever you have a new post out. This will not only get more views for the page, but it can also serve as an opportunity to remind users about a concept, a product they left in their cart, or an exclusive offer to purchase your services.
8. Social Media Engagement
Each business has its own social media approach. For some, Twitter may be too trivial, and for others, Pinterest may be more suitable than a LinkedIn. Regardless of your own strategy, consider the metrics of engagement for that particular social network. Here are some examples:
- Likes: Popular on Facebook and LinkedIn, these are typically a vanity metric used to show a number of users that “agree with” or promote your brand’s personality and offerings.
- Comments: Available on most social networks, comments are one of the most direct forms of engagement. Not only do they prove your user base is real, but you can glean some useful feedback from what they say.
- Share: When a user promotes your content, they essentially “curate” it and brand it with approval for the rest of their network to see. Getting more shares is important as it multiplies the number of views and potential interactions for a particular page.
9. Top Landing Pages
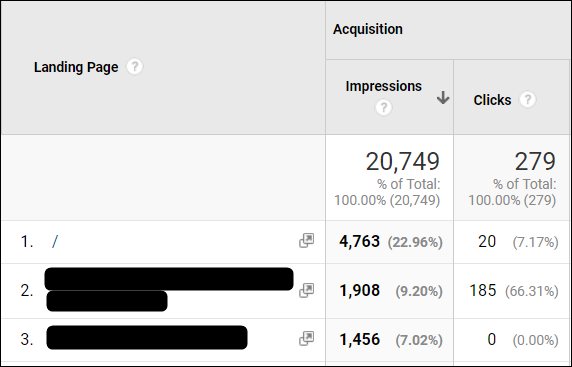
Landing pages are the first pages your visitors land on when they enter your site. Why is this important? It helps understand which content is most visible to your audience on various search engines.
By analyzing which keywords these pages are using, they will give you a better idea of what content people tend to seek out the most.
A screenshot of how the top landing pages section looks in Google Analytics.
10. User Demographics and Interests
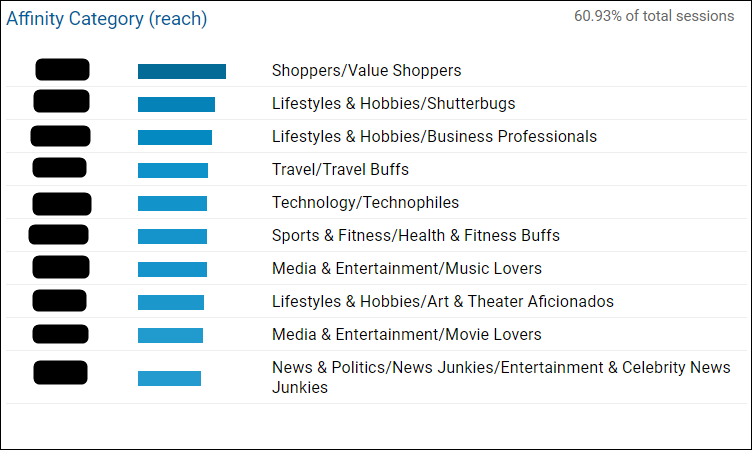
Finally, try to understand who your users are. Google can filter your users by geographic location, metro area, age, gender, and even interests. This information may seem random or irrelevant, but this is a goldmine into understanding who your readers or audience is. Once you know where a majority of them come from or how old they are, you can begin to tailor your content to better suit their needs.
In the image above, you can see the different categories Google tends to categorize its users, based on the content they usually search for and see. In some industries and businesses, the disparity between these categories is more striking.
We’ve always believed that success is a science, and that digital marketing has to rely on real data points and measurements. Without these measurements, it becomes difficult to track what your objectives are, and whether you’re even close to them or not.
Monthly Reports and Fine-Tuning
We recommend a monthly review of all these metrics. Some of these figures won’t change too much or too frequently, but reviewing your digital efforts at the end of each month is a great way to understand your website’s digital presence and areas for improvement.
Do you notice your bounce rate going up? Try adding more internal links to your pages.
Are you seeing fewer conversions for a particular product? Look at the paths that users took to the page and how you can make it a simpler experience.
These are just a few considerations among the many ways you can analyze and evaluate data. For professional agency assistance in doing so, visit Arcalea.com for a quote.


RESPONSES